Gathering and analysing evidence
Your initial discussion with key stakeholders is likely to highlight the need for some more concrete data about student progress in reading and writing. The logical next step, then, is to gather together whatever evidence you have that will help you answer the discussion questions. Examples might include:
- results of standardised tests (such as asTTle, e-asTTle, STAR, PATs, observation surveys)
- running records
- overall teacher judgments in relation to the Reading and Writing Standards and Literacy Learning Progressions
- feedback from literacy support staff
- feedback from teachers, parents/whānau and students.
Use data from your Student Management System (SMS) to create graphs that show the progress of your students over at least two points in time, so you can get a sense of how fast they are accelerating relative to standard peer norm progress rates.
A useful resource when bringing together student data is the excellent (and brief) BECSI guide entitled What kind of student achievement data do we need? This covers all the basics such as exactly which variables to export from the SMS into a spreadsheet such as Excel, which data to get teachers to check for their classes and which tests are appropriate choices for which year levels.
When analysing the data, it is best to do the following:
- Follow the BECSI guidelines for exporting data into a spreadsheet and having teachers do an initial check for errors and typos.
- Identify the people on staff with skills in Excel (particularly generating graphs and writing equations that will calculate difference scores, etc) and call on other support for building such skills among a critical mass of literacy leaders and other teachers.
- Use at least two or three different sources of student achievement data (from two or more different assessment methods) so that you’re not relying on just one. Graph each one, then look across the graphs and displays to understand what each is telling you.
- Use MOE’s guide for calculating effect sizes to give you a gauge of the size of any shifts or accelerations, and to help with interpretation. The effect size tells you how many more (or fewer) standard deviations of progress your students experienced relative to the relevant comparison. Seek out support from MOE or suitably qualified providers to help you get this part right.
The Literacy Learning Progressions/NZC Reading and Writing Standards set out the expectations for progress and achievement in literacy and should guide your decision making.
Summarising student progress against NZC
In the downloadable copy of the "Quick Start Guide" (pages 8 -19) a range of examples is presented to illustrate some of the possibilities for displaying data in ways that will help answer the inquiry questions and stimulate discussion about the underlying causes of successes and disappointments. As mentioned earlier, always use at least two or three complementary sources of student achievement data – no single assessment tool tells the whole story, and teacher professional judgment is an important part of the inquiry and sense-making process.
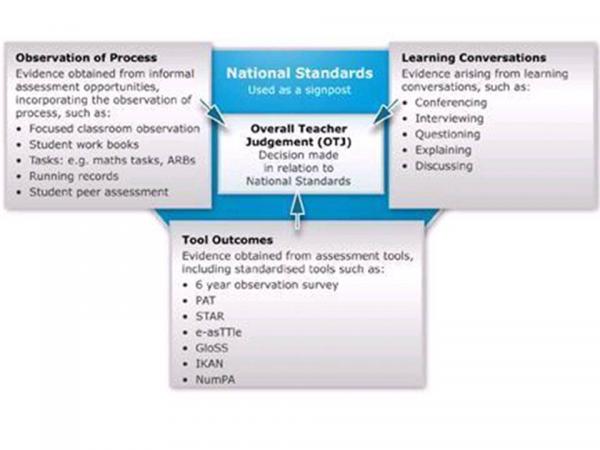
The OTJ guidelines on Te Kete Ipurangi are important here. They outline the need to combine assessment tool data with observations of student process and learning conversations with the student to arrive at an overall judgment about where achievement lies.
For more information on gathering and analysing evidence the following information is included in the Quick Start Guide.
- Summarising student progress against NZC: In this section there are a range of examples to illustrate some of the possibilities for displaying data in ways that will help answer the inquiry questions and stimulate discussion about the underlying causes of successes and disappointments. Always use at least two or three complementary sources of student achievement data – no single assessment tool tells the whole story, and teacher professional judgment is an important part of the inquiry and sense-making process.
- Using a Literacy Progress Grid
- Filling out a Literacy Progress Grid
- Summarising the overall picture of your school
- Interpreting the completed Progress Grid
- Graphing student progress on specific assessment tools: Your school may also wish to plot student achievement in literacy on one or more specific assessment tools so that you can see some of the more fine-grained nuances in your student achievement data.
- asTTle or e-asTTle
Other assessment tools: Guidelines are available online at Te Kete Ipurangi showing how to make interpretations of student performance on:
- e-asTTle Writing
- e-asTTle Reading
- STAR Reading
- PAT Reading Comprehension and Vocabulary
- Observation Survey
- Vocabulary
- Progress Trajectory Graph for junior reading
- Filling out the Progress Trajectory Graph
- Digging beneath average effects
- Interpreting Effect Sizes
Published on: 01 Apr 2016